- Регистрация
- 26.01.14
- Сообщения
- 3,050
- Реакции
- 2,725

Код:
# TS_ValueChartDivergence

# http://www.thinkscripter.com

# thinkscripter@gmail.com

# Last Update 24 Oct 2010

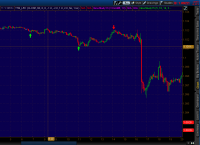
#hint: Displays Value Chart/Price action divergences as arrows.

#hint length: The number of periods used with the associated Value Chart

#hint filterOutSignalsBelow: Threshold required on the Value Chart peaks for divergence signal to be diplayed. The higher the number the more signals that will be filtered out.

input stdevLength = 5;

input avgOfStdevLength = 10;

input DYMILength = 14;

input DYMILengthLowerLimit = 3;

input DYMILengthUpperLimit = 30;

input length = 8;

input price=close;

input filterOutSignalsBelow = 7;

assert(DYMILengthLowerLimit > 0, "'dymi length lower limit' must be positive: " + DYMILengthLowerLimit);

assert(DYMILength between DYMILengthLowerLimit and DYMILengthUpperLimit, "'dymi length' must be between lower and upper limit: " + DYMILength);

def std = stdev(price, stdevLength);

def ratio = std / Average(std, avgOfStdevLength);

def dynamicLength = Floor(DYMILength / ratio);

def limitedLength = if dynamicLength between DYMILengthLowerLimit and DYMILengthUpperLimit then dynamicLength else 0;

def sf = 2 / (limitedLength + 1);

def bn = Max(barNumber(), 0);

# 10^-5 precision for ema multiplier

def expIndex = if limitedLength == 0 then 1 else max(1, bn - ceil(-5 / lg(1 - sf)));

def fromIndex = if isNan(expIndex) then 1 else expIndex;

def chg = price - price[1];

def absChg = AbsValue(chg);

def netChgAvg = fold indexN = fromIndex to bn + 1 with accuN do sf * (if isnan(getValue(chg, bn - indexN)) then 0 else getValue(chg, bn - indexN)) + (1 - sf) * accuN;

def totChgAvg = fold indexT = fromIndex to bn + 1 with accuT do sf * (if isnan(getValue(absChg, bn - indexT)) then 0 else getValue(absChg, bn - indexT)) + (1 - sf) * accuT;

def RSI = if totChgAvg != 0 and limitedLength != 0 then 50 * (netChgAvg / totChgAvg + 1) else RSI[1];

def DYMI = RSI;

def OverBought = 90;

def OverSold = 10;

def VarP = round(length / 5);

def VarA = Highest(high, VarP) - Lowest(low, VarP);

def VarR1 = if VarA == 0 and VarP == 1 then AbsValue(close - close[VarP]) else VarA;

def VarB = Highest(high, VarP)[VarP + 1] - Lowest(low, VarP)[VarP];

def VarR2 = If VarB == 0 and VarP == 1 then AbsValue(close[VarP] - close[VarP * 2]) else VarB;

def VarC = Highest(high, VarP)[VarP * 2] - Lowest(low, VarP)[VarP * 2];

def VarR3 = If VarC == 0 and VarP == 1 then AbsValue(close[VarP * 2] - close[VarP * 3]) else VarC;

def VarD = Highest(high, VarP)[VarP * 3] - Lowest(low, VarP)[VarP * 3];

def VarR4 =

If VarD == 0 and VarP == 1 then AbsValue(close[VarP * 3] - close[VarP * 4]) else VarD;

def VarE = Highest(high, VarP)[VarP * 4] - Lowest(low, VarP)[VarP * 4];

def VarR5 = If VarE == 0 and VarP == 1 then AbsValue(close[VarP * 4] - close[VarP * 5]) else VarE;

def LRange = ((VarR1 + VarR2 + VarR3 + VarR4 + VarR5) / 5) * 0.4;

def Var0 = if AbsValue(close - close[1]) > (high - low) then AbsValue(close - close[1]) else (high - low);

def LRange2 = if high == low then Average(AbsValue(close - close[1]), 1) * 0.4 else Average(Var0, 1) * 0.4;

def range = high + low;

def delta = high - low;

def median = range / 2;

def floatingAxis = Average(median, length);

def dynamicVolatilityUnit = if length <= 7 then LRange2 else LRange;

def relativeHigh = (high - floatingAxis) / dynamicVolatilityUnit;

def relativeLow = (low - floatingAxis) / dynamicVolatilityUnit;

def relativeOpen = (open - floatingAxis) / dynamicVolatilityUnit;

def relativeClose = (close - floatingAxis) / dynamicVolatilityUnit;

def h = relativeHigh;

def l = relativeLow;

def sellDivergence = if high > high[1] and relativeHigh < relativeHigh[1] and relativeHigh[1] > filterOutSignalsBelow then 1 else 0;

def buyDivergence = if low < low[1] and relativeLow > relativeLow[1] and relativeLow[1] < -filterOutSignalsBelow then 1 else 0;

def hiddenDivergenceUp = if low > low[1] and relativeLow < relativeLow[1] then 1 else 0;

def hiddenDivergenceDown = if high < high[1] and relativeHigh > relativeHigh[1] then 1 else 0;

plot upArrow =DYMI<=OverSold AND

if buyDivergence then low else double.nan;

upArrow.SetPaintingStrategy(paintingStrategy.BOOLEAN_ARROW_UP);

upArrow.SetDefaultColor(color.green);

upArrow.SetLineWeight(3);

plot downArrow =DYMI >=OverBought AND if sellDivergence then high else double.nan;

downArrow.SetPaintingStrategy(paintingStrategy.BOOLEAN_ARROW_DOWN);

downArrow.SetDefaultColor(color.red);

downArrow.SetLineWeight(3);

alert(downArrow, "Scalper Buy Signal", Alert.BAR, Sound.ring);

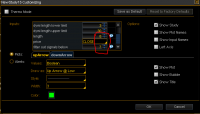
alert(upArrow, "Scalper Buy Signal", Alert.BAR, Sound.ring);меняем последние два значения

Код:
AUD/USD 5-9
NZD/USD 8-9
EUR/JPY 8-9
GBP/JPY 8-7
GBP/USD 8-7
EUR/GBP 8-8
EUR/USD 5-6
USD/JPY 6-11
USD/CHF 6-7
USD/CAD 5-6
GBP/CAD 7-9
GBP/AUD 7-9
Последнее редактирование:


