Андрей
Администратор
- Регистрация
- 28.01.14
- Сообщения
- 353
- Реакции
- 162
Андрей не предоставил никакой дополнительной информации.
Индикаторы от OptionClick.
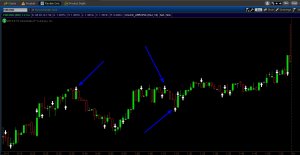
Индикатор №1 OCLICK_ARROWS

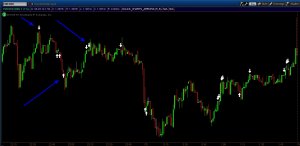
Индикатор №2 OCLICK_CHARTS_ARROWS

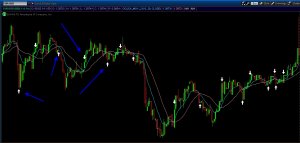
Индикатор №3 OCLICK_MOV_2

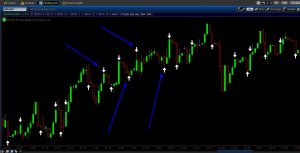
Индикатор №4 OCLICK

Результат тестов OptionClick
Индикатор №1 OCLICK_ARROWS

Код:
# OPTIONCLICK.RU
# info@optionclick.ru
# 27/02/2014

declare upper;
input price = hl2;
input length = 10;
def num = fold count = 1 to length with num_temp = 0 do
    num_temp + (1 + count) * price[count];
def denom = fold count2 = 1 to length with denom_temp = 0 do
    denom_temp + price[count2];
def Ehler_CG = if(denom==0,0,-num/denom);
def CG = Ehler_CG;
def CG1 = Ehler_CG[1];


#
plot UP1 =  if CG crosses above CG1 then low else Double.NaN;
UP1.SetPaintingStrategy(PaintingStrategy.aRROW_UP);
UP1.SetDefaultColor(Color.WHITE);
UP1.SetLineWeight(3);
UP1.HideBubble();
#
plot down1 =  if CG crosses below CG1 then high else Double.NaN;
down1.SetPaintingStrategy(PaintingStrategy.aRROW_DOWN);
down1.SetDefaultColor(Color.WHITE);
down1.SetLineWeight(3);
down1.HideBubble();
Код:
# http://OPTIONCLICK.RU
# info@optionclick.ru
# 27/02/2014

input length = 5;
input filterOutSignalsBelow = 6;

def VarP = round(length / 5);
def VarA = Highest(high, VarP) - Lowest(low, VarP);
def VarR1 = if VarA == 0 and VarP == 1 then AbsValue(close - close[VarP]) else VarA;
def VarB = Highest(high, VarP)[VarP + 1] - Lowest(low, VarP)[VarP];
def VarR2 = If VarB == 0 and VarP == 1 then AbsValue(close[VarP] - close[VarP * 2]) else VarB;
def VarC = Highest(high, VarP)[VarP * 2] - Lowest(low, VarP)[VarP * 2];
def VarR3 = If VarC == 0 and VarP == 1 then AbsValue(close[VarP * 2] - close[VarP * 3]) else VarC;
def VarD = Highest(high, VarP)[VarP * 3] - Lowest(low, VarP)[VarP * 3];
def VarR4 =
If VarD == 0 and VarP == 1 then AbsValue(close[VarP * 3] - close[VarP * 4]) else VarD;
def VarE = Highest(high, VarP)[VarP * 4] - Lowest(low, VarP)[VarP * 4];
def VarR5 = If VarE == 0 and VarP == 1 then AbsValue(close[VarP * 4] - close[VarP * 5]) else VarE;
def LRange = ((VarR1 + VarR2 + VarR3 + VarR4 + VarR5) / 5) * 0.2;

def Var0 = if AbsValue(close - close[1]) > (high - low) then AbsValue(close - close[1]) else (high - low);
def LRange2 = if high == low then Average(AbsValue(close - close[1]), 5) * 0.2 else Average(Var0, 5) * 0.2;

def range = high + low;
def delta = high - low;
def median = range / 2;
def floatingAxis = Average(median, length);
def dynamicVolatilityUnit = if length <= 7 then LRange2 else LRange;
def relativeHigh = (high - floatingAxis) / dynamicVolatilityUnit;
def relativeLow = (low - floatingAxis) / dynamicVolatilityUnit;
def relativeOpen = (open - floatingAxis) / dynamicVolatilityUnit;
def relativeClose = (close - floatingAxis) / dynamicVolatilityUnit;

def h = relativeHigh;
def l = relativeLow;

def sellDivergence = if high > high[1] and relativeHigh < relativeHigh[1] and relativeHigh[1] > filterOutSignalsBelow then 1 else 0;
def buyDivergence = if low < low[1] and relativeLow > relativeLow[1] and relativeLow[1] < -filterOutSignalsBelow then 1 else 0;

def hiddenDivergenceUp = if low > low[1] and relativeLow < relativeLow[1] then 1 else 0;
def hiddenDivergenceDown = if high < high[1] and relativeHigh > relativeHigh[1] then 1 else 0;

plot upArrow = if buyDivergence then low else double.nan;
upArrow.SetPaintingStrategy(paintingStrategy.BOOLEAN_ARROW_UP);
upArrow.SetDefaultColor(color.white);
upArrow.SetLineWeight(3);

plot downArrow = if sellDivergence then high else double.nan;
downArrow.SetPaintingStrategy(paintingStrategy.BOOLEAN_ARROW_DOWN);
downArrow.SetDefaultColor(color.white);
downArrow.SetLineWeight(3);

plot continuationDown = if hiddenDivergenceDown then high else double.nan;
continuationDown.SetPaintingStrategy(paintingStrategy.BOOLEAN_ARROW_DOWN);
continuationDown.SetDefaultColor(color.white);
continuationDown.SetLineWeight(1);
continuationDown.hide();


plot continuationUp = if hiddenDivergenceUp then low else double.nan;
continuationUp.SetPaintingStrategy(paintingStrategy.BOOLEAN_ARROW_UP);
continuationUp.SetDefaultColor(color.white);
continuationUp.SetLineWeight(1);
continuationUp.hide();
Код:
#OPTIONCLICK.RU
#info@optionclick.ru
#27/02/2014

input EMAPeriod = 10;
input SMAPeriod = 20;
input price = close;
def na = double.nan;
plot fastema = ExpAverage(price, EMAPeriod);
plot slowema = Average(price, SMAPeriod);
def crossover = if fastema > slowema AND fastema[1] <= slowema[1] then 1 else 0;
def crossunder = if fastema < slowema AND fastema[1] >= slowema[1] then 1 else 0;
#Plot arrows
Plot up = if crossover then low - tickSize() else na;
Plot down = if crossunder then high + tickSize() else na;
up.SetPaintingStrategy(PaintingStrategy.BOOLEAN_ARROW_DOWN);
down.SetPaintingStrategy(PaintingStrategy.BOOLEAN_ARROW_UP);
up.SetLineWeight(3);
up.AssignValueColor(color.WHITE);
down.SetLineWeight(3);
down.AssignValueColor(color.WHITE);

#Trigger alerts

alert(crossover[1], "Crossover", Alert.Bar, Sound.Ding);
alert(crossunder[1], "Crossunder", Alert.Bar, Sound.Ding);
Код:
# OPTIONCLICK.RU SIGNALS REALTIME
# 24/02/2014
# info@optionclick.ru
Input AlertsOn = no;
Input ShowTodayOnly = yes;
Def Today = if !ShowTodayOnly then 1 else if getday() == getLastDay() then 1 else 0;
def space = average(high-low)/5;
# buy signal
plot ppsBuy = If !Today then Double.NaN else pps().buySignal-space;
ppsBuy.SetPaintingStrategy(PaintingStrategy.BOOLEAN_ARROW_DOWN);
ppsbuy.SetLineWeight(5);
ppsBuy.AssignValueColor(color.WHITE);
alert(AlertsOn && ppsBuy, “PPS Buy Signal”,alert.BAR, sound.Ring);
# sell signal
plot ppsSell = If !Today then Double.NaN else pps().sellSignal+space;
ppsSell.SetPaintingStrategy(PaintingStrategy.BOOLEAN_ARROW_UP);
ppsSell.SetLineWeight(5);
ppsSell.AssignValueColor(color.WHITE);
alert(AlertsOn && ppsSell, “PPS Sell Signal”,alert.BAR, sound.Bell);
Результат тестов OptionClick
Последнее редактирование модератором:


