Андрей
Администратор
- Регистрация
- 28.01.14
- Сообщения
- 355
- Реакции
- 163
Андрей не предоставил никакой дополнительной информации.
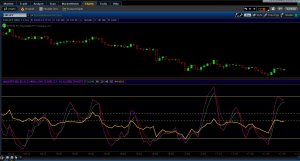
Индикатор Stochastic TDT with RSI:


Код:
declare lower;
declare all_for_one;

input over_bought = 80;
input over_sold = 20;
input KPeriod = 5;
input DPeriod = 3;
input priceH = high;
input priceL = low;
input priceC = close;
input slowing_period = 2;
input smoothingType = 1;

plot SlowK = reference StochasticFull(over_bought,  over_sold,  KPeriod,  DPeriod,  priceH,  priceL,  priceC,  3, if (smoothingType== 1) then "SMA" else "EMA").FullK;
SlowK.SetDefaultColor(GetColor(0));

plot SlowD = reference StochasticFull(over_bought,  over_sold,  KPeriod,  DPeriod,  priceH,  priceL,  priceC,  3, if (smoothingType== 1) then "SMA" else "EMA").FullD;
SlowD.AssignValueColor (if slowD >= slowD [1] then Color.UPTICK else Color.DOWNTICK);

plot OverBought = over_bought;
OverBought.SetDefaultColor(GetColor(0));

plot OverSold = over_sold;
OverSold.SetDefaultColor(GetColor(0));

plot Line1 = 45;
line1.SetStyle(Curve.SHORT_DASH);
line1.SetDefaultColor(color.white);


plot Line2 = 55;
line2.SetStyle(Curve.SHORT_DASH);
line2.SetDefaultColor(color.white);

input length = 14;
input price = close;

def NetChgAvg = WildersAverage(price - price[1], length);
def TotChgAvg = WildersAverage(AbsValue(price - price[1]), length);
def ChgRatio = if TotChgAvg != 0 then NetChgAvg / TotChgAvg else 0;

plot RSI = 50 * (ChgRatio + 1);

RSI.DefineColor("OverBought", GetColor(5));
RSI.DefineColor("Normal", GetColor(7));
RSI.DefineColor("OverSold", GetColor(1));
RSI.AssignValueColor(if RSI > over_Bought then RSI.color("OverBought") else if RSI < over_Sold then RSI.color("OverSold") else RSI.color("Normal"));
OverSold.SetDefaultColor(GetColor(8));
OverBought.SetDefaultColor(GetColor(8));


